Predictive Valuation Engine
End to end ML solution combining property and neighborhood risk data
1 Business Context
A regional real estate investment firm needed to systematically evaluate residential property values across the Chicago metropolitan area. Their existing approach relied on manual comparable analysis, which couldn't scale to their deal flow, and failed to account for neighborhood-level risk factors that significantly influence property values. The business question was clear: how can we predict property value with enough precision to make faster, more confident acquisition decisions?
2 The Data Challenge
The project required integrating multiple large-scale datasets that didn't naturally align:
Property Transaction Data
~50,000 residential sale records with property attributes (beds, baths, square footage, property type, year built) and sale prices across multiple years.
Crime Incident Records
900,000+ crime incident logs spanning four years with latitude/longitude coordinates, incident type, and timestamp, requiring geographic aggregation by neighborhood.
Chicago Crime Density by Community Area
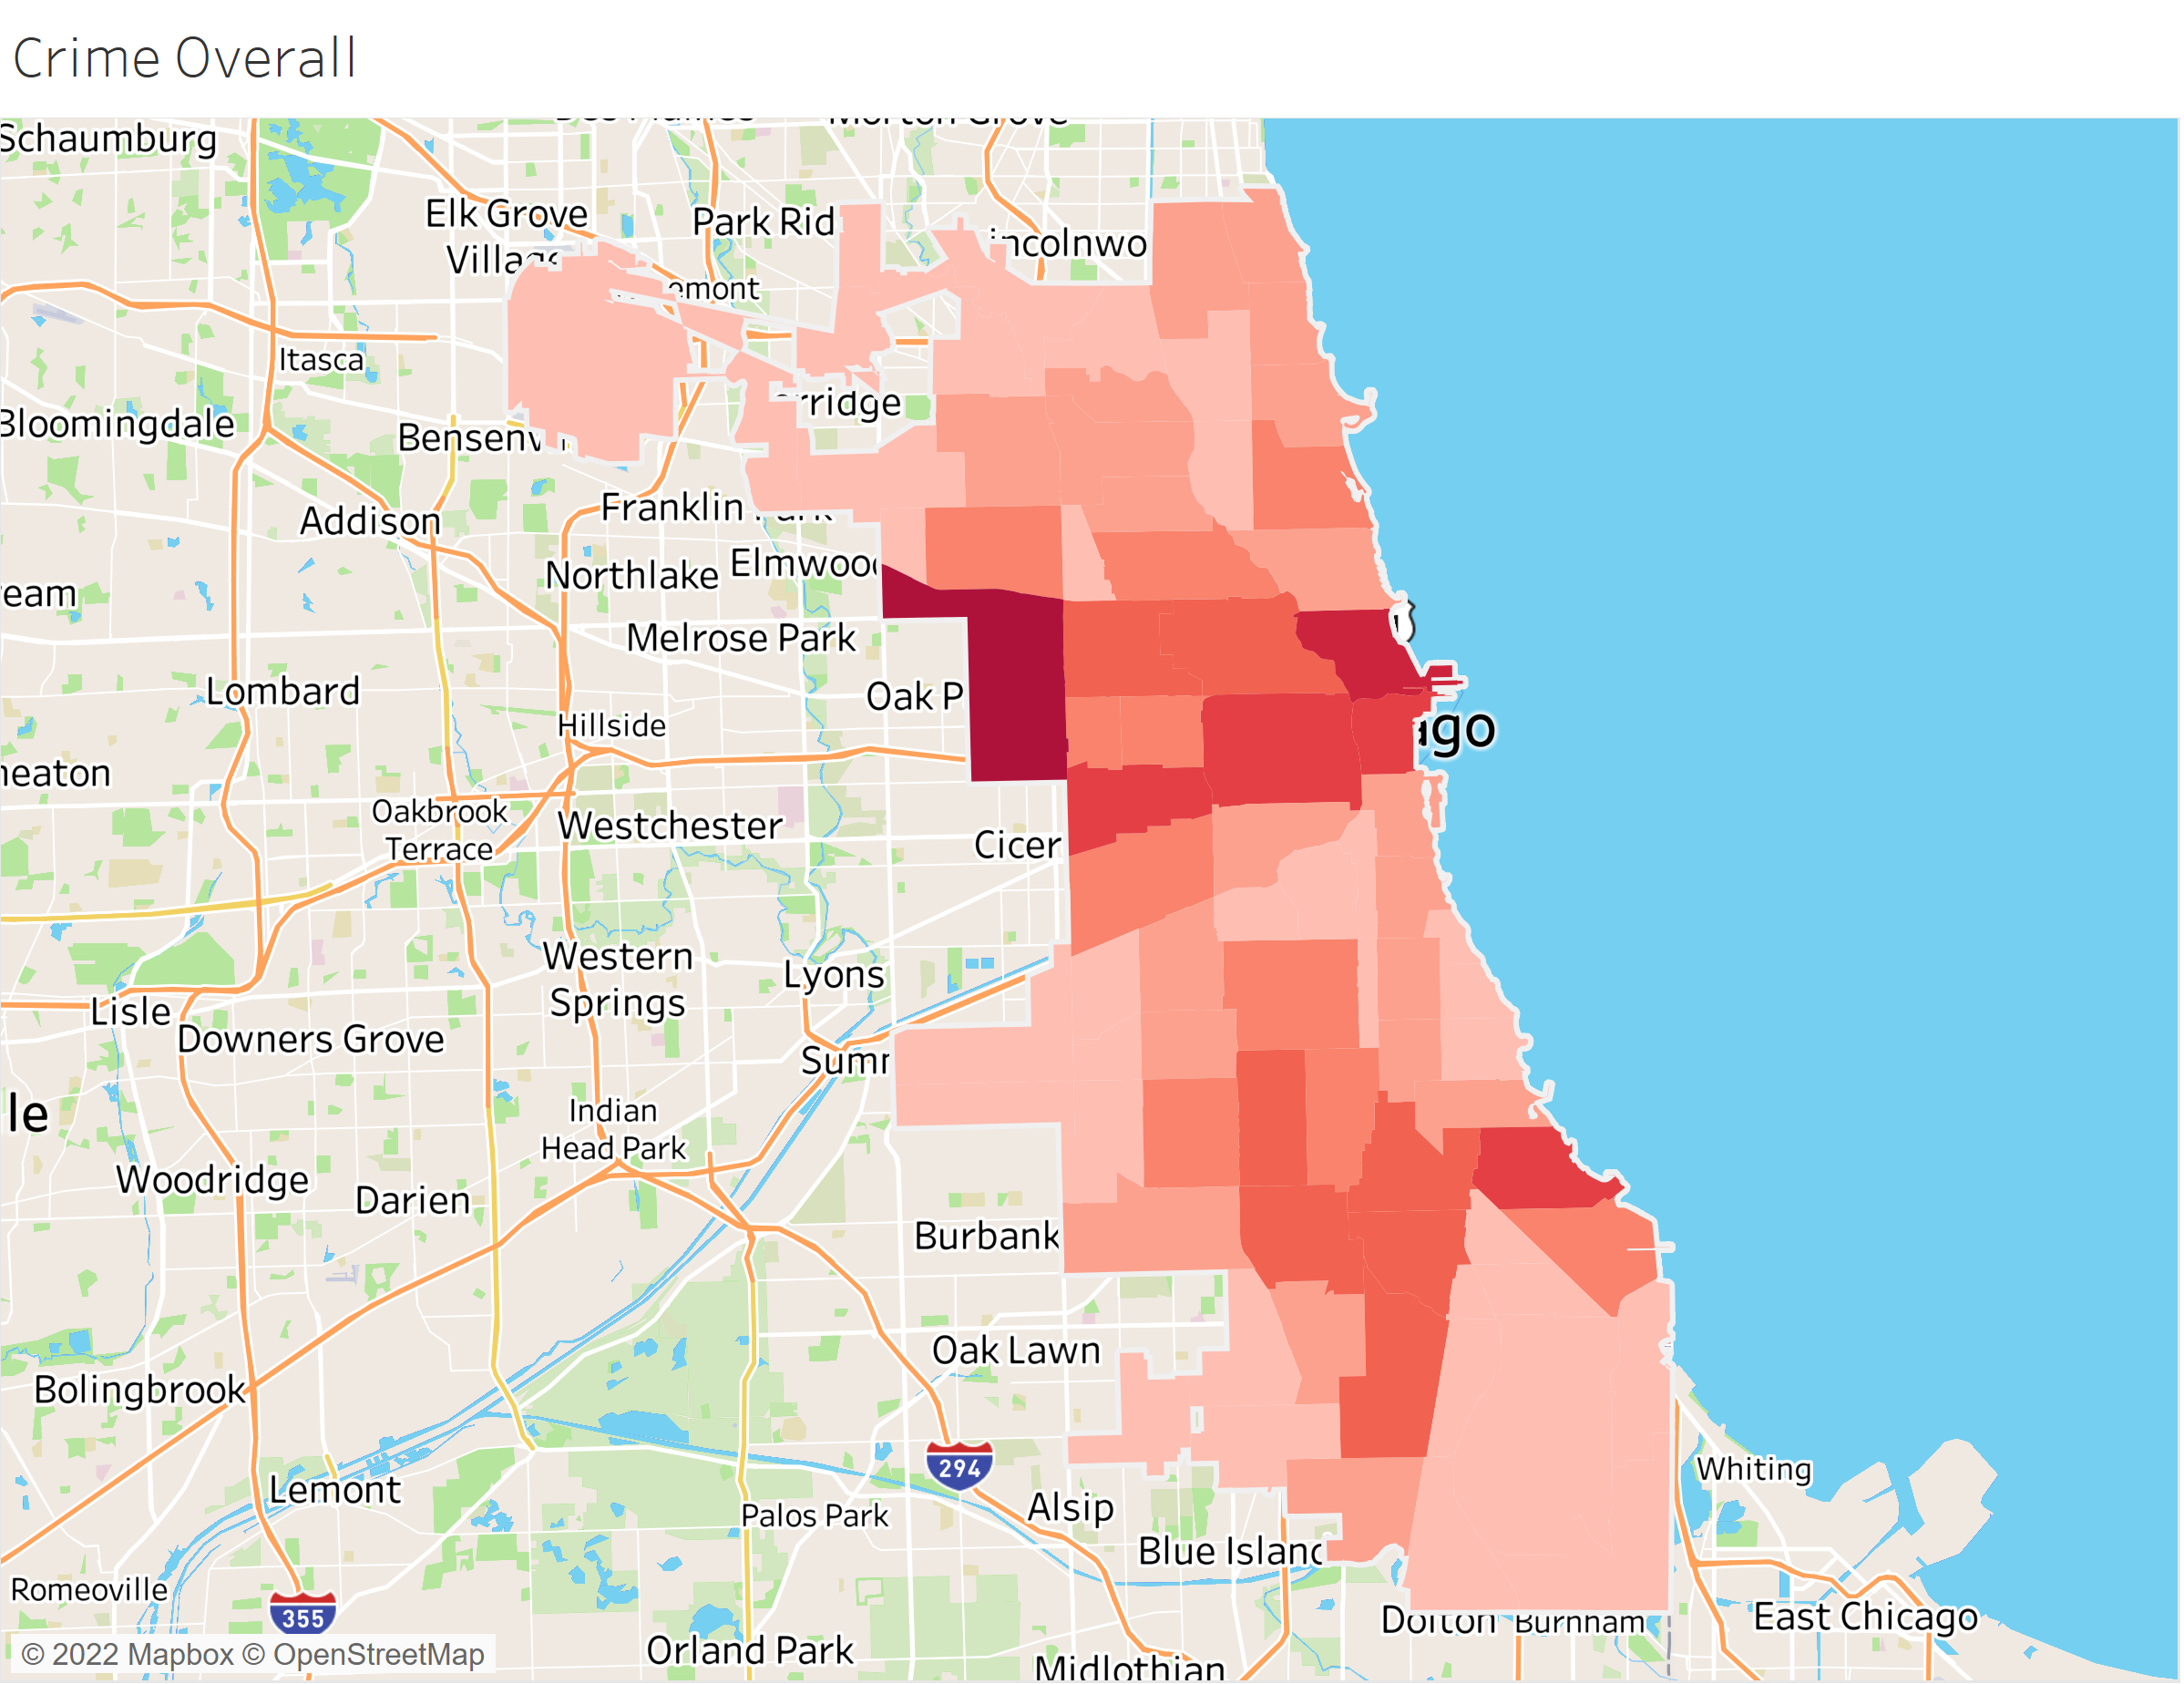
Geographic visualization of crime density used to create neighborhood risk indices
The key engineering challenge was linking crime data (reported at latitude/longitude) to property records (reported by address and neighborhood name). This required building a neighborhood-to-community-area mapping layer and aggregating crime statistics at that level.
3 Technical Approach
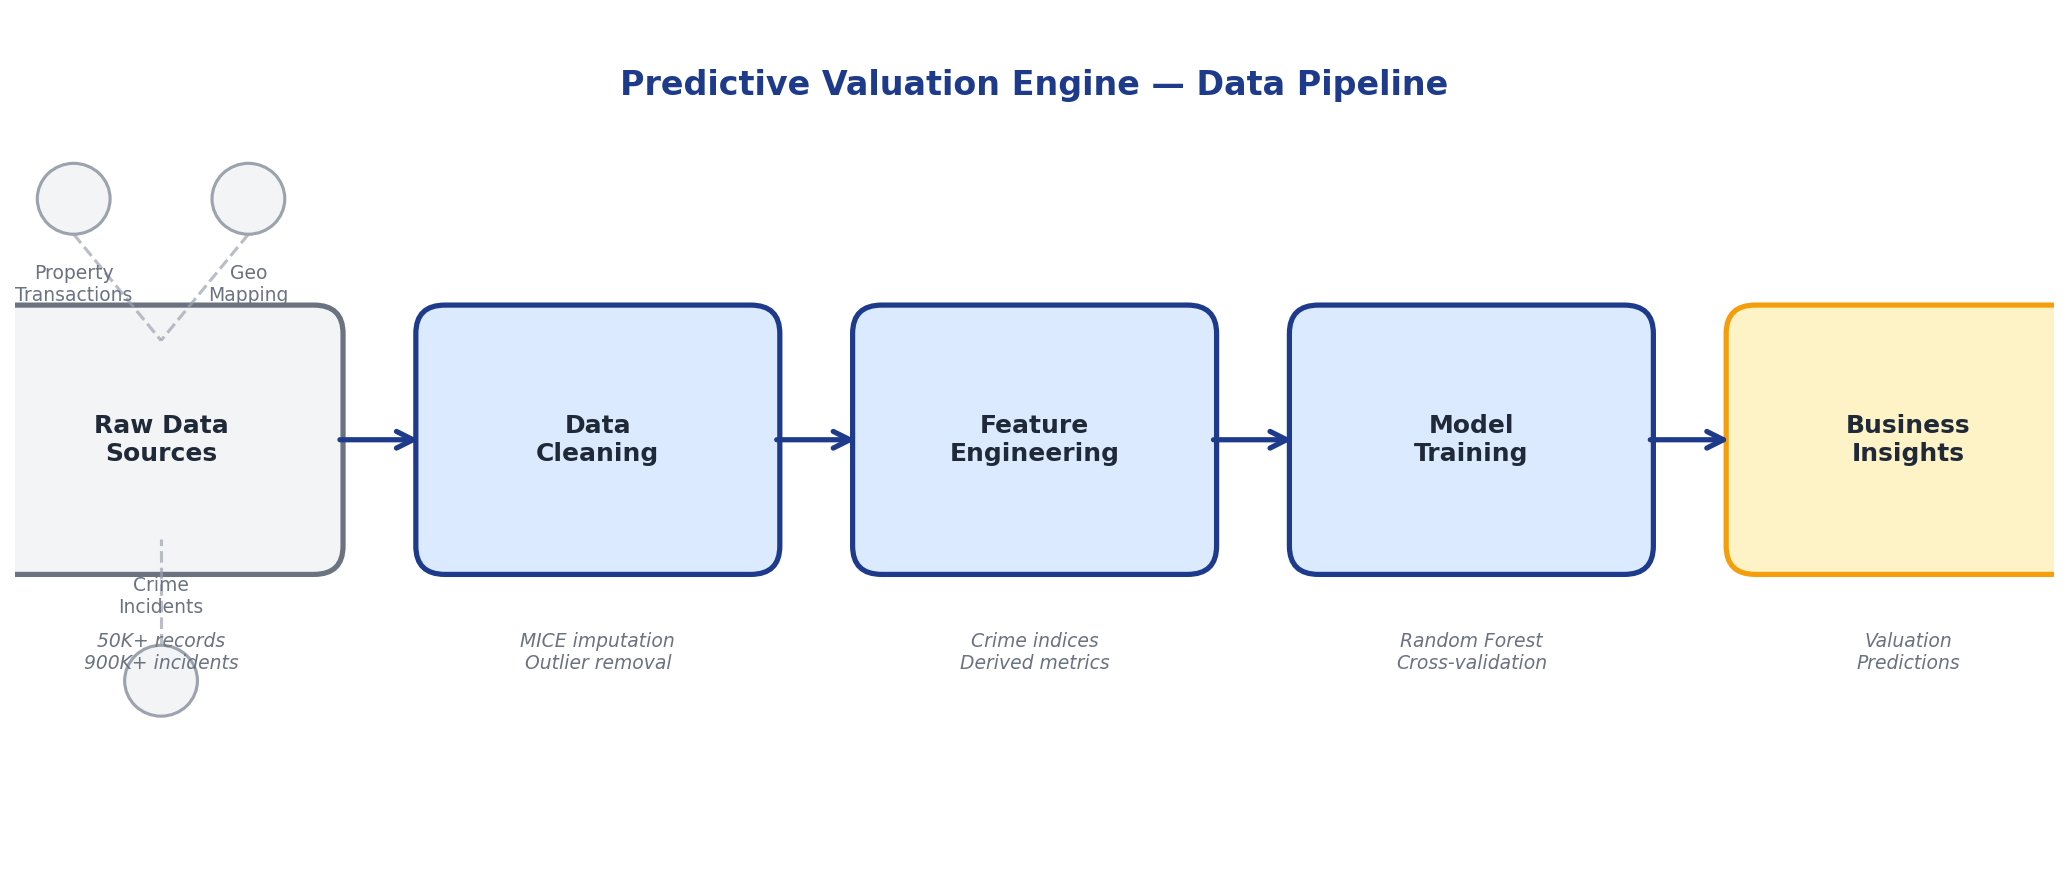
Data Preparation & Feature Engineering
Using Python (pandas, NumPy) and SQL for transformation, I cleaned and standardized property records, handled missing values through MICE imputation, and created derived features like price per square foot and property age. For crime data, I aggregated incidents by community area and crime type to create neighborhood risk indices.
Geospatial Integration
Built a mapping dictionary to translate 77 Chicago community area codes to neighborhood names, enabling the join between crime statistics and property records. This step alone unlocked the ability to incorporate external risk factors into the valuation model.
Model Development
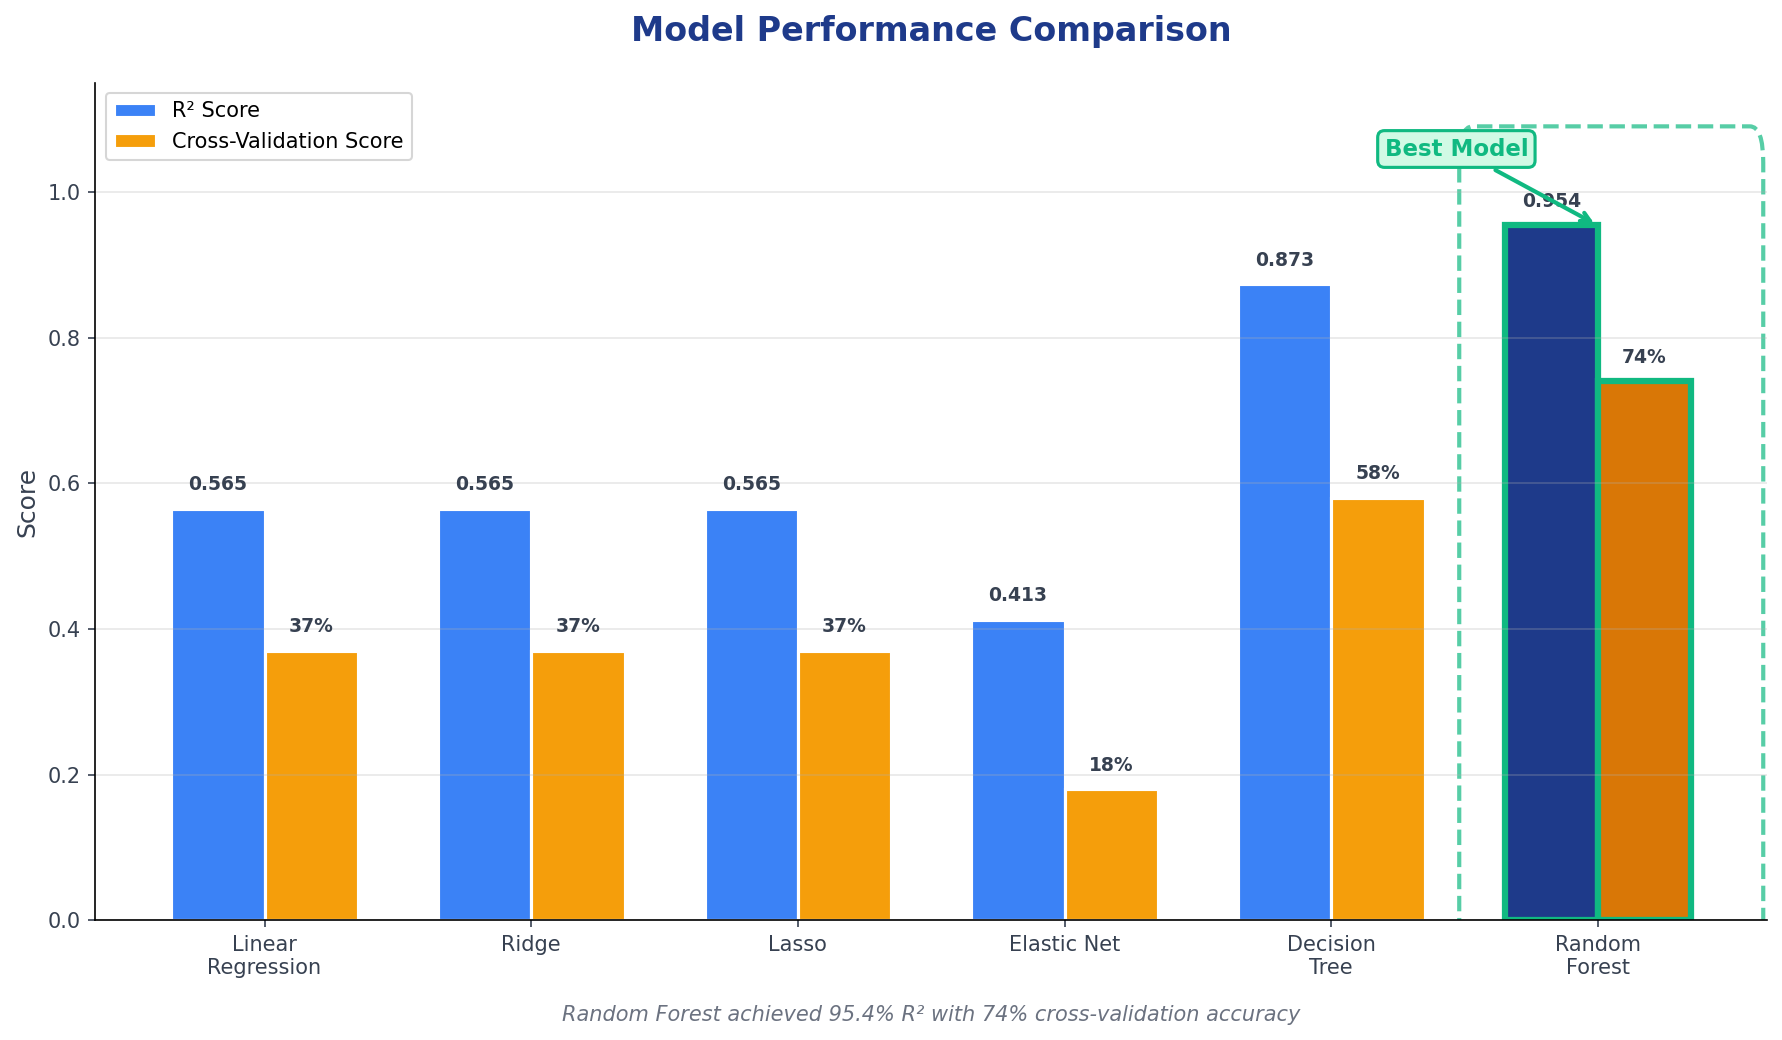
Tested multiple regression approaches including Ridge Regression, Random Forest, and Gradient Boosting. Used GridSearchCV for hyperparameter tuning and cross-validation to prevent overfitting. The final ensemble model combined property-level features with neighborhood crime density scores.
Model Performance Comparison
Model Feature Importance
Top predictive features from Random Forest model (importance scores normalized)
4 Key Insights
85%+
Variance explained by final model
Top 5
Features drove 60% of predictive power
+12%
Accuracy lift from crime features
Crime density at the neighborhood level proved to be a significant predictor. Properties in higher crime areas showed predictable valuation discounts even after controlling for property characteristics. This validated the business intuition and provided a quantifiable risk adjustment factor.
5 Business Impact
The model enabled the firm to screen acquisition targets at scale, prioritize site visits based on predicted value to price ratios, and quantify neighborhood risk in investment memos. The approach reduced due diligence time per property and provided a defensible, data driven basis for pricing negotiations.
Technical Stack
Languages: Python (pandas, NumPy, scikit-learn), SQL | Methods: Random Forest, Ridge Regression, GridSearchCV, MICE Imputation, TF-IDF | Tools: AWS, Jupyter, Folium (geospatial visualization)